

How to Become a Super Duper Data Researcher: Statistical Cohorts vs Group Cohorts
By Kellie Kelly
In my previous article, I explained the importance of Statistical Cohort Analysis to understand student performance and student learning outcomes. I asked HSE Administration the following question, “Have you been looking at the Statistical Cohort Analysis Data to determine an action plan to help HSE students recover from Covid Learning Loss?”
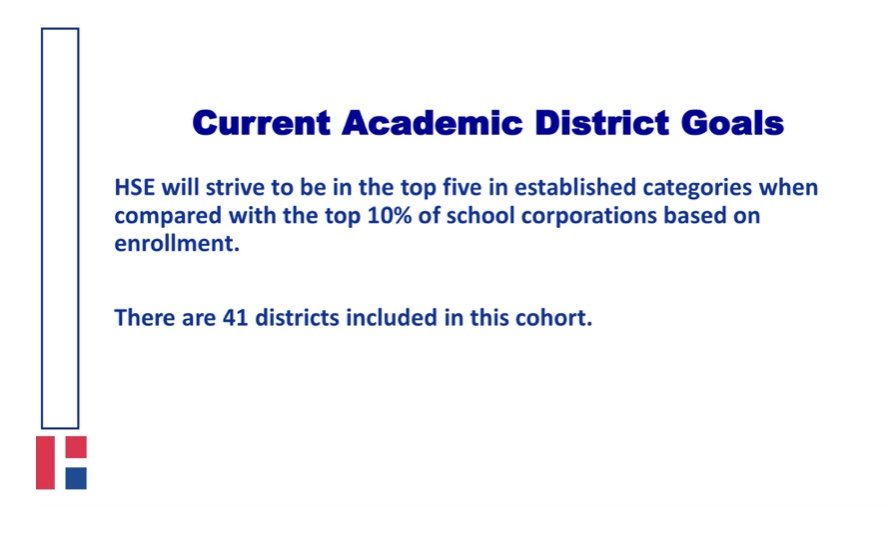
The following two slides were given in a recent presentation by the HSE administration to discuss Academic District Goals. You can see that HSE used the word “cohort." But, is this Statistical Cohort Analysis?
No, it is not. HSE is choosing 41 school districts based on criteria they selected in order to create an analysis comparison between these 41 districts. HSE is creating a cohort, or group of data, and only staying within this group to compare scores. This type of analysis can be called Group Cohort Analysis. HSE will then look at differences between school districts in this cohort group to attempt to determine if HSE students are academically successful when compared to student populations in the other 40 school districts.
And why is this not the best way to look at data? Well, for starters you aren’t comparing apples to apples. The real strength of Statistical Cohort Analysis lies in the fact that you are tracing the SAME group of students OVER a specific period of TIME. For example, let’s consider what happened with ILEARN proficiency scores from 2019 to 2021. They nosedived due to Covid Learning Loss. Using Statistical Cohort Analysis and looking at HSE proficiency percentages we can see the decline in Math was far greater than the decline in English/Language Arts for HSE students. This observation from the data can then be used to create policy and to set goals to help HSE students recover in Math.
However, if we are only comparing HSE scores with other school district populations and all other school district populations share the same trend in proficiency scores, then the data will not show any significant differences, and in some cases may be misleading. Consider this chart HSE presented showing changes in Math ILEARN scores from 2021 to 2022. By just looking at this chart, it appears that Brownsburg Community Schools is doing poorly. Its bar chart is the shortest. However, the truth of the matter is far different.

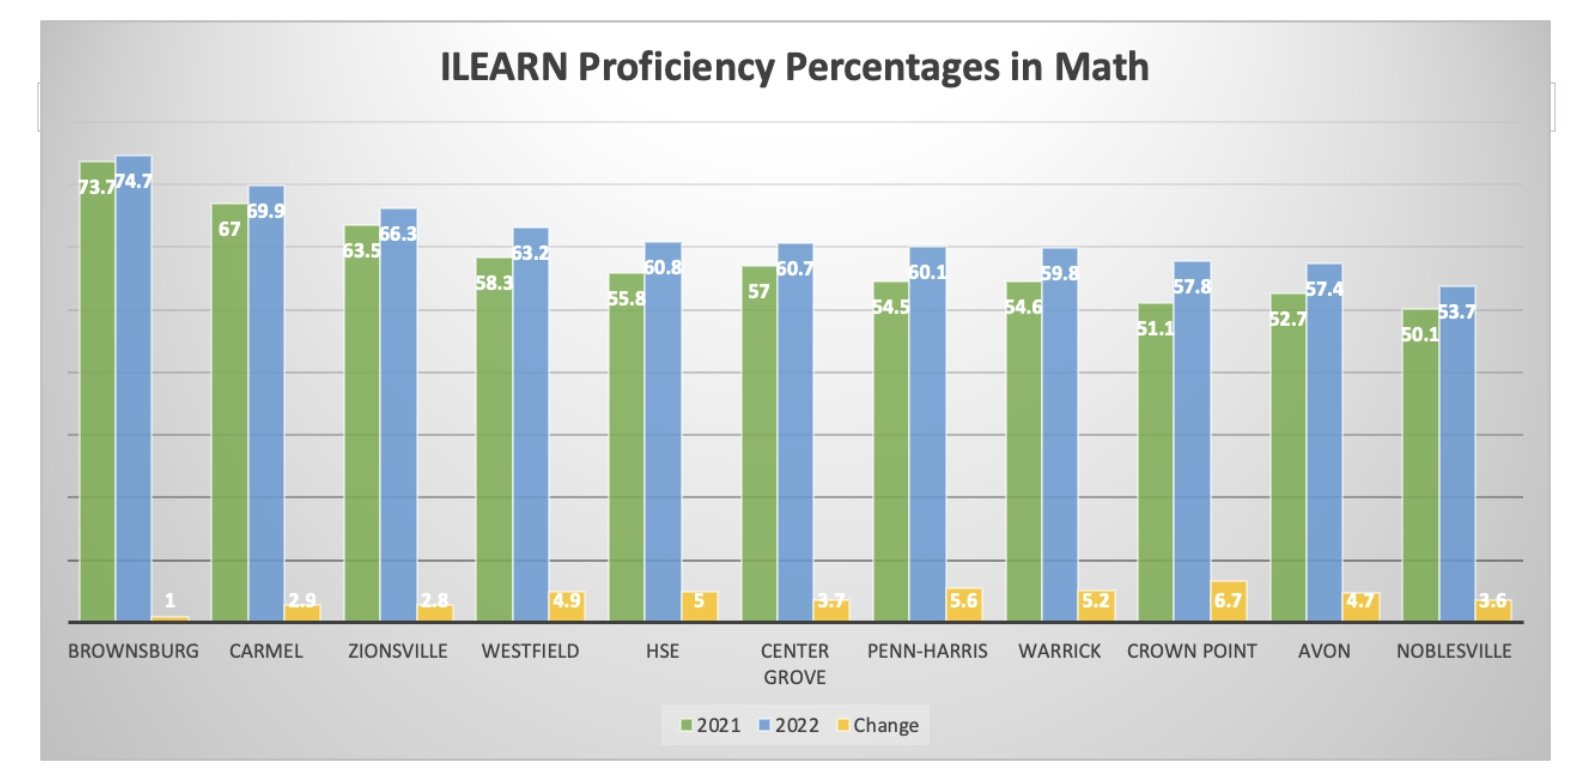
Here is the graph we should be looking at in order to compare Math Proficiency Percentages on ILEARN between these school districts.
The green bars show the Math Proficiency Percentages for the school districts in 2021. The blue bars show the Math Proficiency Percentages for the school districts in 2022. The yellow bars show the change, which is the 2022 percentage minus the 2021 percentage. You can verify that the numbers above the yellow bars correspond to the numbers in the chart from HSE titled “Math Change.” But, which graph shows us the whole story? Looking at HSE’s Math Change graph, Brownsburg Schools had the smallest change. But, that is because their scores are so much higher to begin with. Which school district is performing better in Math on the ILEARN exam, HSE or Brownsburg?
Let’s look at a Statistical Cohort Table on Math Change for HSE next to a Group Cohort Chart on Math Change to see which provides the more valuable data.

Math Change in Statistical Cohorts for HSE Math Change in Group Cohorts
The Math Change in Group Cohorts Chart tells us two things: HSE improved by five percentage points on the ILEARN test from last year, and that other school districts in the cohort had different changes in growth. And as pointed out above, the graph may mislead some to believe that Brownsburg Schools’ small amount of growth is bad, while that is not the true story at all. The five percent increase in the Group Cohort chart does not compare the same population of HSE students from 2021 to 2022. Plus, it’s a combined percentage increase in math for grades three to eight, so it doesn’t provide any information about specific grade levels.
Using Statistical Cohort Analysis we can trace the SAME group of students from YEAR to YEAR in each cohort to look at learning increase or decrease. For example, we can see that incoming Freshmen have a learning decrease in Math of 1.1%. Incoming Eighth Graders show an increase of 2.3%, incoming Seventh Graders show an increase of 1.9%, incoming Sixth Graders show a decrease of 0.5%, and incoming Fifth Graders show the largest decrease in ILEARN Math scores of 2.6%. With Statistical Cohort Data you can easily see which Cohort of Students requires the most assistance. Group Cohort Data Analysis doesn’t provide this information since it is only comparing one school district’s overall performance to another.
Hopefully, you are now a super duper data researcher and can tell the differences between Statistical Cohorts and Group Cohorts. You can see the strengths and weaknesses of the different approaches. And how the same data can tell different stories. Data is important because it drives school policy and helps allocate resources for learning outcomes. We are all stakeholders in this community and are invested to make sure our public schools are providing the best education for our children. HSE administration should be committed to implementing the most sound statistical practices when interpreting quantitative data in order to make the best educational choices for our children.